The dashboard that looks important but feels confusing
You've seen the screen.
It's 9:15 AM. You just posted a fresh Reel sending people to "the link in our bio." You grab your phone, open your link-in-bio tool, and stare at a dashboard full of numbers that look important but feel confusing.
Clicks: 1,247. Click-through rate: 4.2%. Conversions: 12.
Is that good? Bad? Should you be concerned?
Here's the truth most "analytics experts" won't tell you: most link-in-bio metrics are vanity metrics unless you know what story they're actually telling.
Let's fix that. No math degree required.
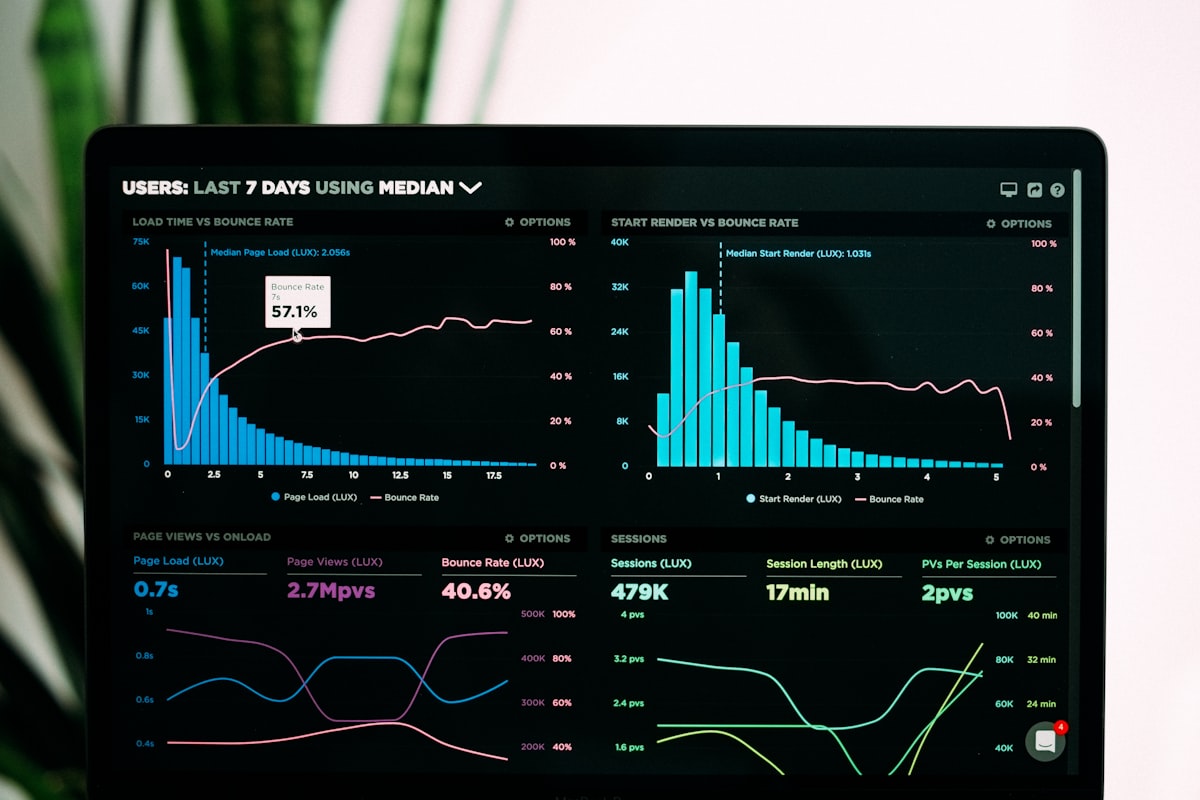
*A dashboard full of numbers means nothing without context.*
First, stop obsessing over raw clicks
Total clicks don't matter. Okay — that's not entirely true. They matter to your ego. They matter when you're reporting to a sponsor. But for actually growing your business? Raw clicks are like counting how many people walked past your storefront without ever opening the door.
Here's why:
A fitness influencer with 500,000 followers might get 800 clicks to a $5 meal plan. A B2B consultant with 12,000 followers might get 200 clicks to a $3,000 discovery call.
Who wins? The consultant, every single day. Because they're not chasing clicks. They're chasing qualified action.
So before you read another number, ask yourself one question: what do I actually want people to do after they tap?
Buy something? Sign up for an email list? Book a call? That answer changes everything about how you read your analytics.
The one metric that actually predicts success
Forget click-through rate for a second. Look at drop-off by position.
Most link-in-bio tools will show you where people are leaving your link menu. Example:
- Link 1 (Featured product) → 68% of taps
- Link 2 (Free guide) → 19% of taps
- Link 3 (Podcast episode) → 8% of taps
- Link 4 (Blog post) → 3% of taps
- Link 5 (Affiliate link) → 2% of taps
The drop-off is violent after Link 2. And that's not a bug — it's human behavior.
What this actually tells you: your audience will tap the first or second thing that feels immediately valuable. Everything else is digital wallpaper.
Action step: take your bottom three links and delete them today. Put that energy into making your top two links unstoppable.
Click-through rate is a liar (sometimes)
Everyone panics about CTR. "My CTR dropped from 5% to 3%! What did I do wrong?!"
Calm down. Here's what's probably happening:
Scenario A: You grew your audience. More followers often means more casual followers who don't know you yet. Your CTR will naturally dip when you add people who are still in "who is this person?" mode.
Scenario B: You posted less frequently. CTR is a ratio of clicks to impressions. If you posted three times yesterday vs. once today, that ratio changes even if the same number of people click.
Scenario C: You changed your CTA. "Link in bio for the discount code" will always outperform "Link in bio to learn about our mission." Don't be mad at the numbers. Be honest about the offer.
The real question isn't "Is my CTR high?" It's "Is my CTR consistent relative to my traffic source?"
If your Instagram Stories CTR is 8% and your TikTok bio CTR is 1.5%, that's not a crisis. Different platforms, different intentions. People on Stories are actively swiping. People landing on your TikTok bio often just wanted to see if you have a YouTube channel.

*Different platforms, different intent — don't compare CTRs across channels.*
The conversion gap will break your heart (unless you watch it)
Here's where most creators stop looking.
They see 1,000 clicks to their shop link. Then 40 add-to-carts. Then 12 purchases. And they think, "My link-in-bio isn't working."
But look closer. The problem isn't the link. The problem is almost always the landing page:
- Your page took longer than 3 seconds to load (mobile users bounce fast)
- Your price wasn't visible above the fold
- You asked for too much information
- The design looked untrustworthy
Your link-in-bio analytics are just messengers. Don't shoot the messenger because the checkout page is broken.
Pro move: set up a UTM parameter on your bio link — something like ?utm_source=instagram&utm_medium=bio. Then look at your analytics behavior flow. You'll see exactly where people land and where they bail. That's gold.
Time of day data is weirder than you think
Most tools show you hourly click data. And most people look at it wrong.
They'll see a spike at 8 PM and think, "That's my best time to post!" But that spike might be from a post you made at 6 PM that finally hit the Explore page. Or it might be people in other time zones. Or one random Reddit thread driving traffic.
Watch time-of-day data over 30 days. Look for consistent patterns, not heroic spikes.
Also: weekend link clicks often convert better than weekday clicks, even if volume is lower. Why? Because weekend browsers have time to actually read. Weekday tappers are usually on a quick scroll break.
The silent killer: broken or rotating links
Here's a conversation I've had many times:
Creator: "My clicks are down 40%."
Me: "Did you change your link last week?"
Creator: "Oh, yeah. I rotated in a new affiliate offer."
Me: "Did you check if that link works on mobile?"
Silence.
Check your links weekly. Not monthly. Weekly. On an actual phone. With actual thumbs.
Broken links don't show up in your dashboard as an error. They just show up as zero conversions. And you're left wondering why.
How to read your numbers like someone who makes money
Here's a practical framework:
The Green Zone — celebrate, then double down:
- Conversion rate from click to sale above 3%
- Drop-off rate below 20% on your first two links
- Returning clicks above 15% (people are saving your link)
The Yellow Zone — tweak, don't panic:
- CTR between 2–5% depending on platform
- Drop-off after link 3 or 4
- One bad day after a post flops (happens to everyone)
The Red Zone — actually change something:
- Less than 1% CTR over 30 days with consistent posting
- More than 60% drop-off on your primary link
- Zero conversions from 1,000+ clicks
Notice what's not in the red zone? Low total clicks. Small audience size. A bad week. Those things fix themselves with consistency. The red zone stuff is your system asking for help.
The one question nobody asks
After all these numbers, here's the most important question:
Are you actually proud of what's behind the link?
I've seen creators obsess over analytics for a mediocre lead magnet. They tweak colors. They change CTAs. They A/B test button text. And the whole time, the real problem was that the thing behind the link just wasn't that good.
Good analytics can't save a weak offer. Great content makes mediocre analytics look fine.
So before you rebuild your entire strategy, ask yourself: if you tapped that link right now, would you be excited? Or would you shrug and close the tab?
Be honest.
What to do Monday morning
Close the dashboard. Open your notes app. Write down:
- Your one conversion goal — not "more clicks," an actual business outcome
- Your top two links — delete the rest
- A calendar reminder to check mobile links every Friday
That's 90% of the work. The remaining 10% is patience. Let the numbers build over 90 days. Don't change everything because Tuesday was quiet. Don't declare victory because Thursday popped off.
Link-in-bio analytics aren't mysterious. They're just humans telling you, click by click, what they actually care about. Most of the time, they care about one or two things. The rest is noise.
Give them those one or two things. Make them easy to find. Track what happens after the click.
And for the love of good data — check that your page works on an iPhone with one bar of signal.